Data has become central to the business game since we entered the Information Age. Due to the sheer size and deep penetration of data in our lives, it holds a higher position than oil in the economy. An incomprehensible amount of data is generated by internet users across the globe.
Big Data is the term that represents heaps of unstructured and unprocessed data that businesses can utilize to make strategic decisions. Big Data can be processed to find insights about the market & improve the decision-making process.
Making a decision that is not backed by data is like shooting arrows in the dark. Such decisions are simply biased opinions. Organizations deploy Big Data to replace opinions with data-backed analysis.
Big data can be classified in three ways:
The classification is done based on the degree of analysis the data has gone through. Before analysis, the data goes through a process called ETL or Extraction-Transform-Load. Here, the data is processed to become easily readable and effectively stored for usage. Once analyzed to be read by an application, only then can data be used as actionable insight.
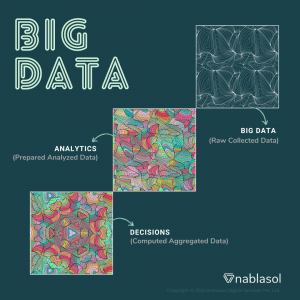
Data
This is the raw data collected or acquired by the business. Primarily this is called a Data Lake where various data types are lumped together, impossible to differentiate. At this stage, the data cannot be organized using any schema.
Generally, companies do not have the bandwidth to store and process data by themselves. Although on-premise data storage is more secure, the volume of data is so huge that it is not feasible. Today, businesses opt for cloud storage and distributed storage for more efficiency.
Analytics
In this stage, big data is processed, prepared, and analyzed using automated systems. The systems perform big data analytics depending on the insights sought and other strategic objectives. The scale and frequency of data at this level are enormous as well and require huge computing power.
Initially, the majority of non-required or faulty data is removed from the system to simplify things. The rest of the data is then sorted and filtered to be structured in a particular manner.
Decisions
At this stage, the analyzed data is computed using certain parameters to make interpretations. These insights help the business take logical and data-driven decisions. The job of interpreting the data is done by a data scientist who used the parameters to get insights from the data.
At this level, visualization of data also helps make these decisions more effectively. Leveraging the power of Big Data can help businesses make more strategic inroads in their industries.