Stay Updated with Real-Time Data Visualization
Empower your business with the strength of data to fast-track your company growth with Business Reporting.
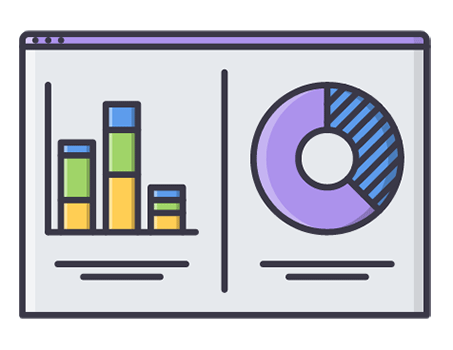
Our collaborative Business Reporting software helps you capture and record specific data points for each operation and business function across multiple departments. It provides data visualization of the key metrics, giving you the ability to identify and correct negative trends encountered. The dashboard visualization helps business owners and managers to improve their decision-making process. As a result, it increases business performance and drives growth.
Improve Business Strategy with Custom Data Visualization
Here are some of the benefits and features of our business reporting platform.
Track Key Metrics
Chart Visualization
The chart visualization type creates eight different forms for graphs. Use relevant charts that convey the right meaning for your business.
Value Reporting
Custom Dashboard
Easily create beautiful visualizations with drag and drop functionality. Combine them into a single dashboard for efficient reporting.
Predictive Analysis
Define Alerts
Create customized alerts for identifying trends or limits. Define conditions as per your business and be alerted instantly when your data changes.
Real-Time Analysis
Automated Querying
Charts and Dashboards automatically get updated at regular intervals defined, giving you access to clear and concise real-time reporting.
Collaborative Approach
Peer Sharing
Share visualizations by enabling peer review of reports. Share your data story with colleagues, teams, or external vendors.
