About the Client
A U.S.-based tax services firm headquartered in Jacksonville, Florida, serving clients nationwide. The B2C operation generated hot and cold leads from more than 100 sources across a diverse marketing mix.
Service Area
Custom Marketing Attribution Model & Analytics
Tool Stack
Custom marketing attribution model, real-time sales data, campaign and keyword-level reporting
Lead Generation Sources
As a B2C business, the client used multiple channels to generate, educate, nurture, and convert leads. More than 100 lead sources contributed to the pipeline, including:
- Lead Source Providers
- PPC Networks: Google, Facebook, and Bing
- Broadcasting: Radio and TV advertising
- Email Campaigns
- Content Affiliates
- Referrals
The mix gave the client a broad lead pipeline, but it also made it harder to understand which sources were generating the strongest sales outcomes and where marketing spend was producing the most value.
The Challenge
- Matching lead status from the sales team to see which sources converted fastest was a manual struggle.
- Vendor billing varied ( some fixed cost-per-lead, some fixed weekly commission), with invoices and per-lead accounting changing every week.
- Sales data kept evolving as leads matured in the funnel, so time itself became a variable in finding the best channel.
- On PPC, the team needed to pin down which keywords brought revenue-generating leads; on radio, which stations and time slots worked, all tied to segmented tax problems.
The Approach
Nablasol built a custom marketing attribution model that combined lead-source data with real-time sales information. The model brought together acquisition costs, lead quality, sales outcomes, and customer value to give the marketing team a consistent way to evaluate performance across sources.
Built a custom attribution model
Combined real-time sales data with marketing and lead-source information to evaluate channel performance as leads moved through the sales funnel.
Tracked multiple performance variables
The model incorporated cost per lead, total commission, lead qualification, gross sales value, deals approved, and deals out.
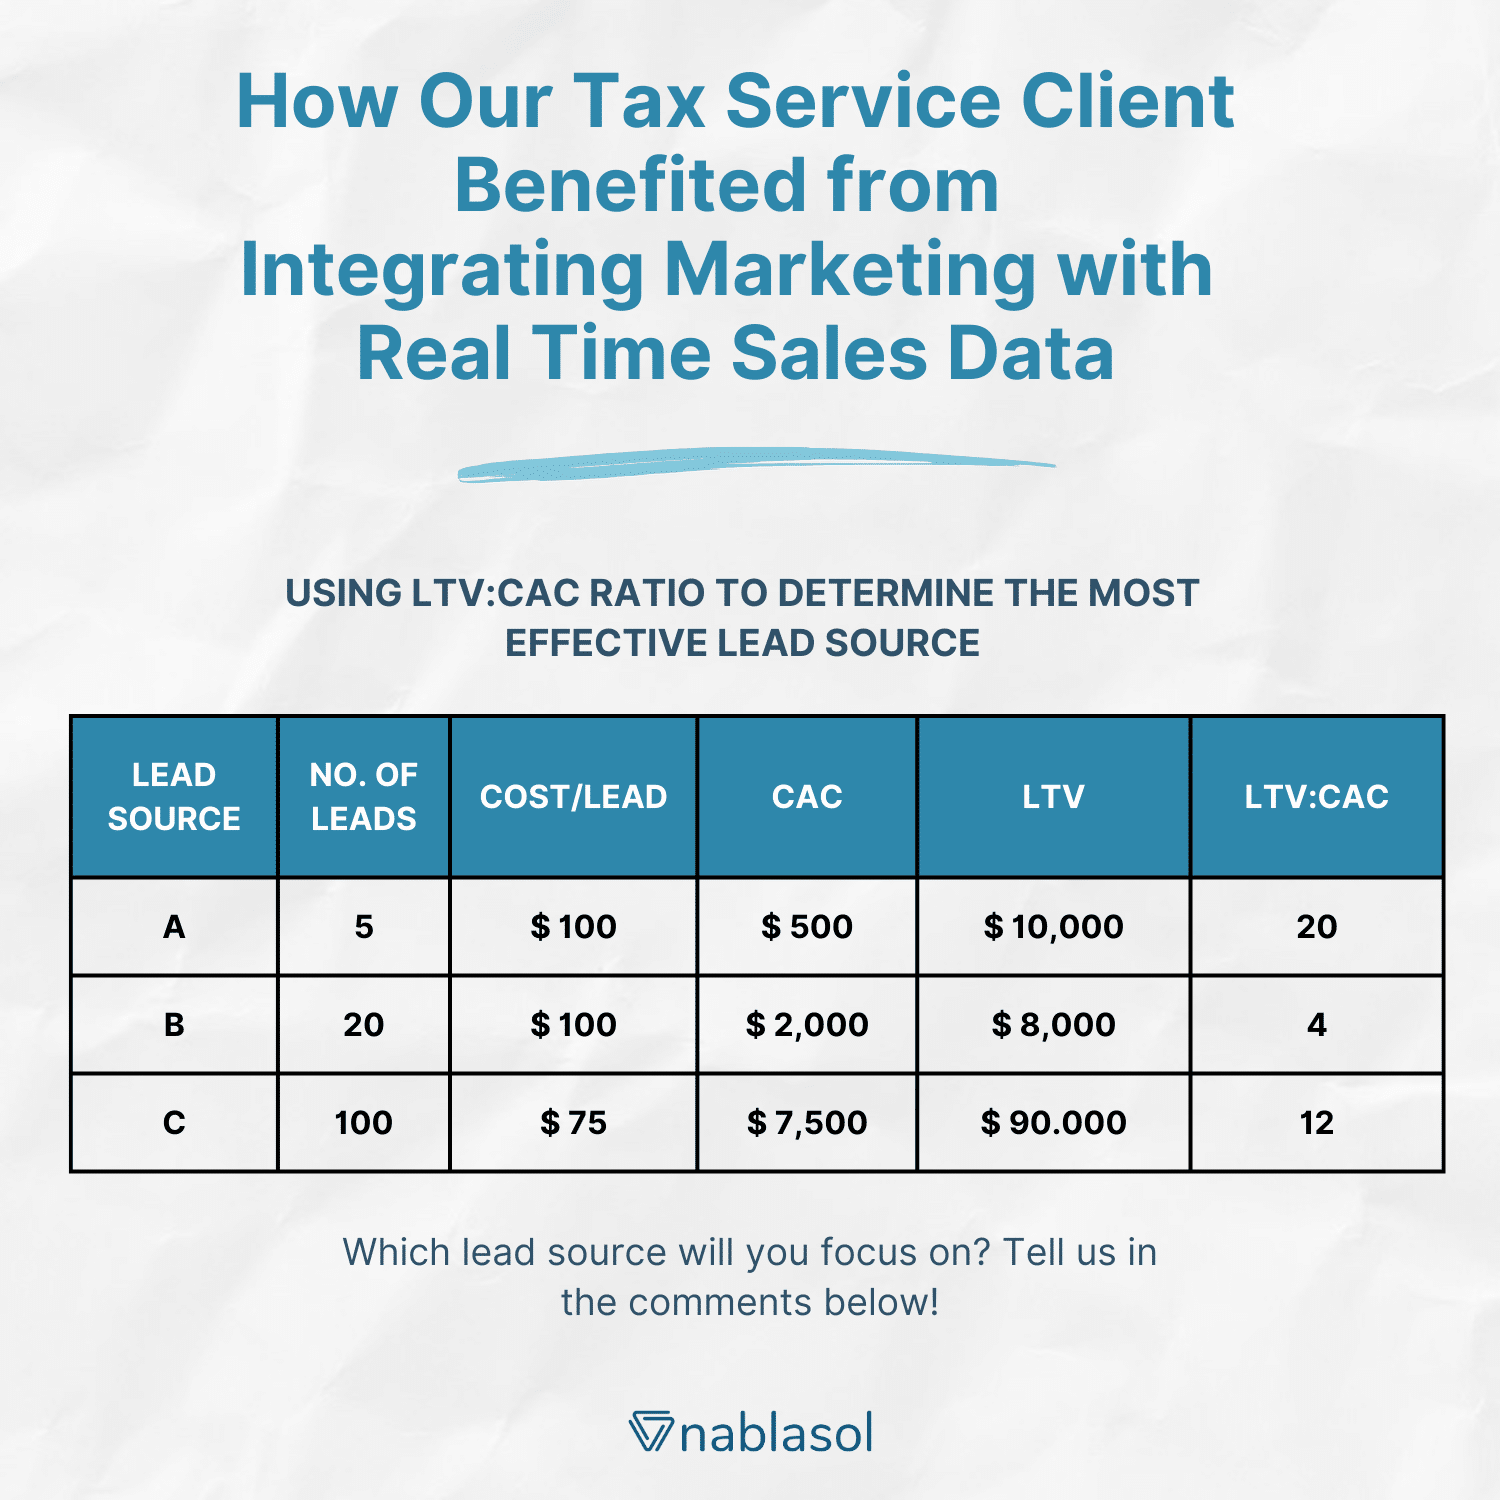
Used LTV CAC as a core KPI
The model compared Lifetime Customer Value with Customer Acquisition Cost to evaluate the revenue quality of different lead sources.
The ratio LTV : CAC represented the quality of marketing channels in terms of sales revenue.

A dynamic comparison showed how different sources could require different marketing decisions:
Lead Source A: Just 5 leads generated $10K in revenue. While its total revenue was lower than Source C, the higher revenue per lead indicated an opportunity to optimize the campaign and generate more leads.
Lead Source C: Generated the highest revenue volume, but required a much larger number of leads. This made the channel more capital-intensive, while also creating opportunities to increase customer value through additional services.
Lead Source B: Generated neither strong revenue volume nor high-quality leads, making it a candidate for budget reallocation toward stronger-performing sources.
This gave the marketing team a more useful view than lead volume alone: which sources were generating revenue, at what acquisition cost, and with what quality of leads.
Automated variable vendor-cost calculations
Because vendors used different pricing structures and invoices changed over time, the system automated the calculations and incorporated a cooling-off period into the sales cycle.
Created actionable marketing reports
Campaign-level and keyword-level reporting helped the team evaluate PPC performance, while sales data was also used to identify effective radio stations, timing, and advertising context.
The Result
- Quantified marketing performance across a large and varied lead-source portfolio.
- Reduced marketing expense by giving the team better visibility into channel performance.
- Improved sales conversion rates by helping the team identify higher-quality lead sources.
- Created a single decision-making dashboard for leadership to evaluate where marketing budget should be allocated.
Spending across dozens of lead sources and unsure which actually pay off? See what real-time attribution could show you.
BOOK A FREE SYSTEM AUDIT, and we’ll look at how your lead and sales data connect and where your budget works hardest.